
Transcribed Image Text
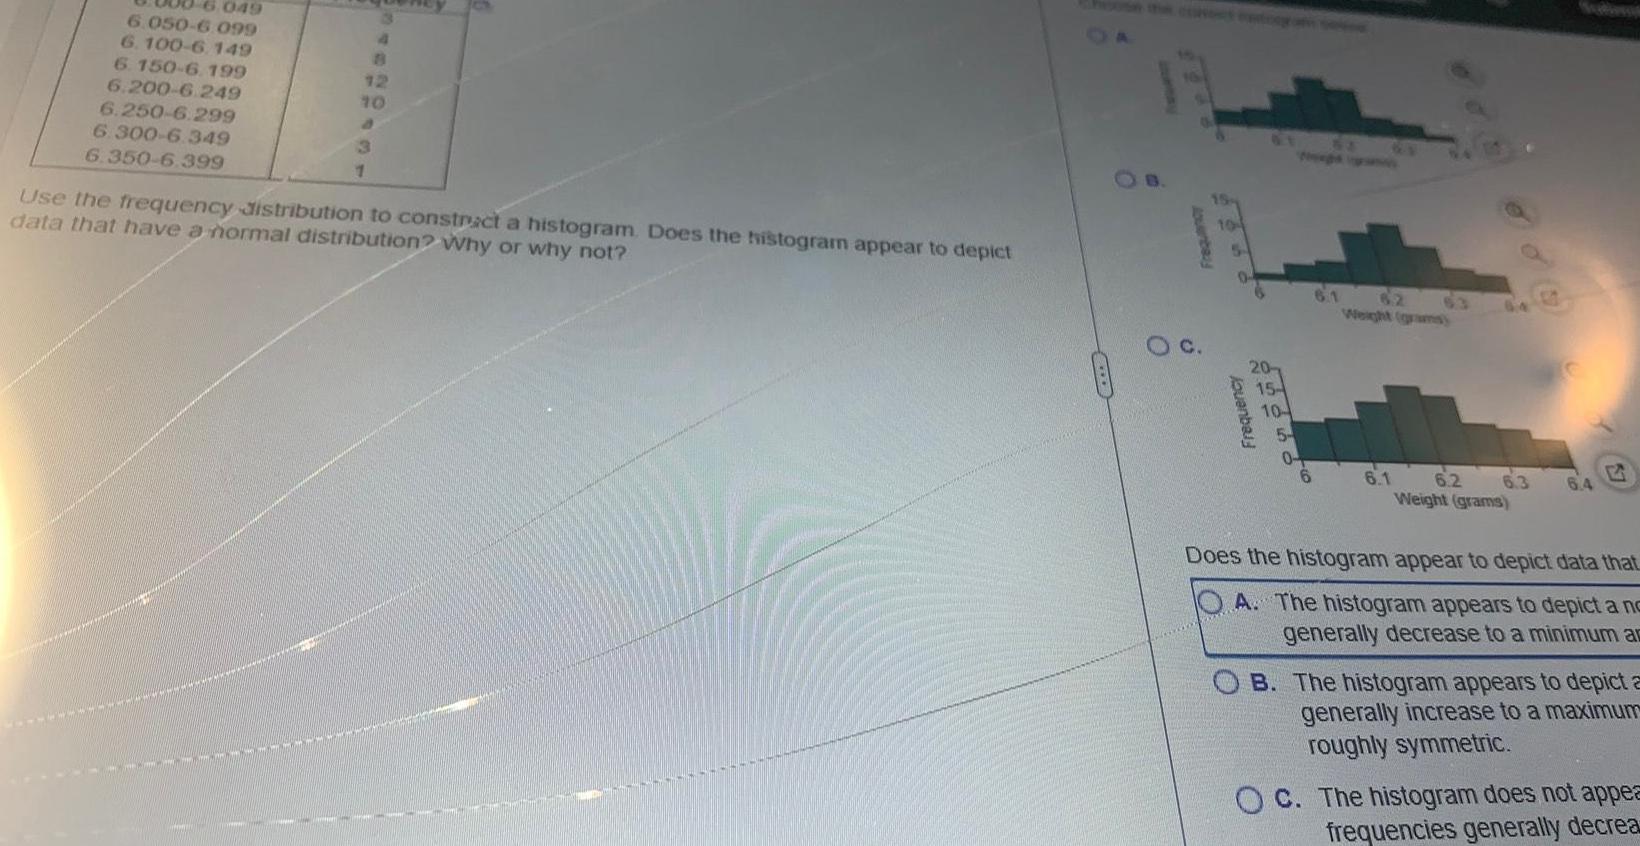
6 049 6 050 6 099 6 100 6 149 6 150 6 199 6 200 6 249 6 250 6 299 6 300 6 349 6 350 6 399 4 18 12 10 3 1 Use the frequency distribution to construct a histogram Does the histogram appear to depict data that have a normal distribution Why or why not turhay O Frequency 104 5 Jouanbaly 20 15 10 5 0 61 6 1 6 2 Weight grams 6 3 6 4 Does the histogram appear to depict data that OA The histogram appears to depict a no generally decrease to a minimum a OB The histogram appears to depict a generally increase to a maximum roughly symmetric OC The histogram does not appea frequencies generally decrea
Other questions asked by students
Electrical Engineering
Accounting
Accounting
Accounting