
Transcribed Image Text
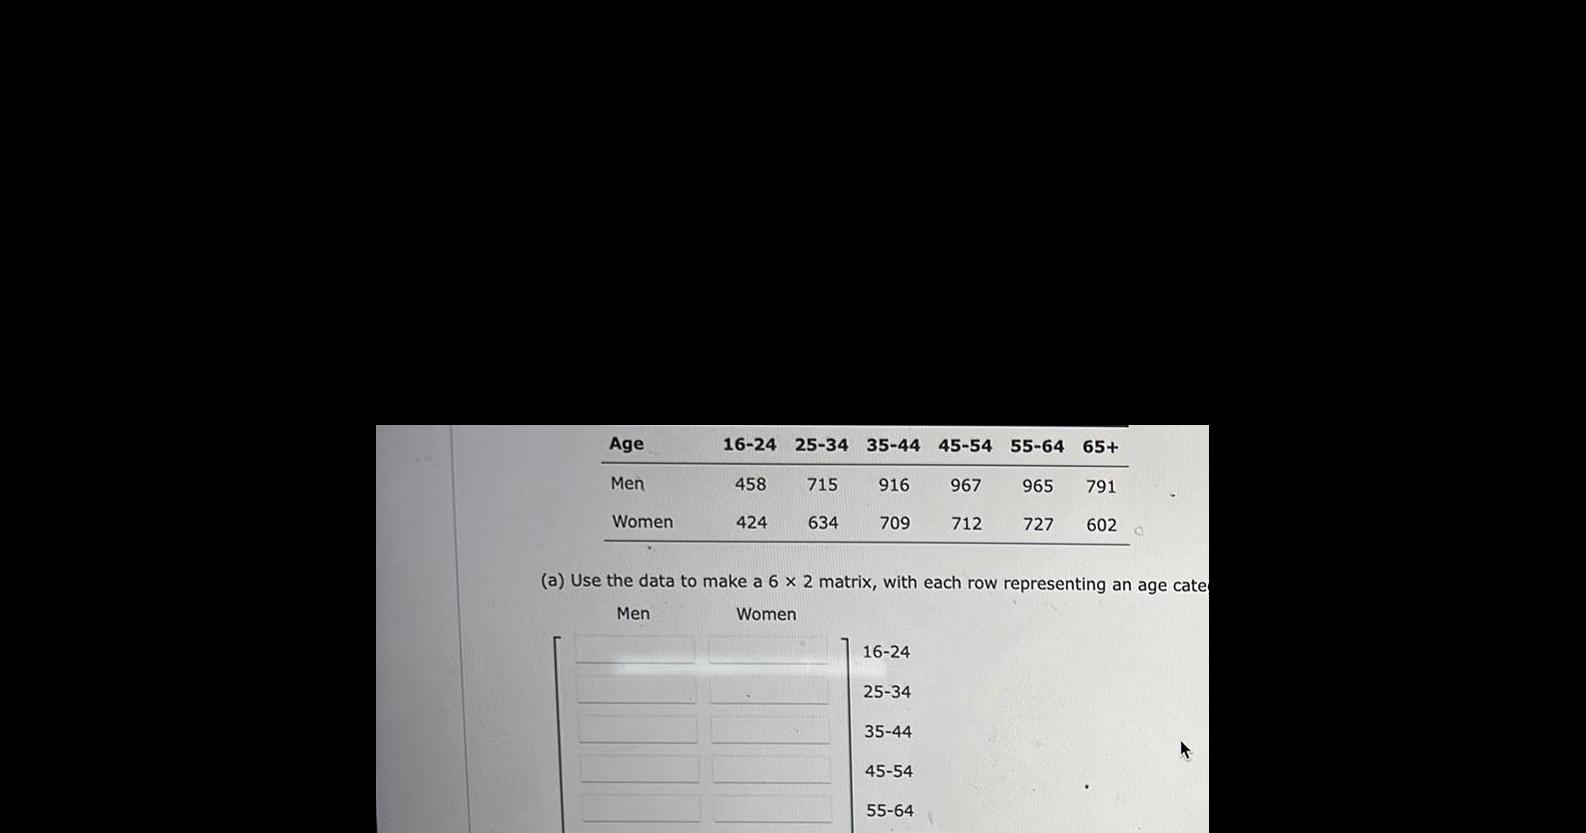
Age Men Women 16 24 25 34 35 44 45 54 458 424 715 916 634 709 16 24 25 34 a Use the data to make a 6 x 2 matrix with each row representing an age cate Men Women 35 44 967 45 54 55 64 712 55 64 65 965 791 727 602
Other questions asked by students
Advance Math
Accounting
Q
All about Apple: Describe their information management system (IMS). Does their IMS give them a...
Accounting
Accounting
Accounting