
Transcribed Image Text
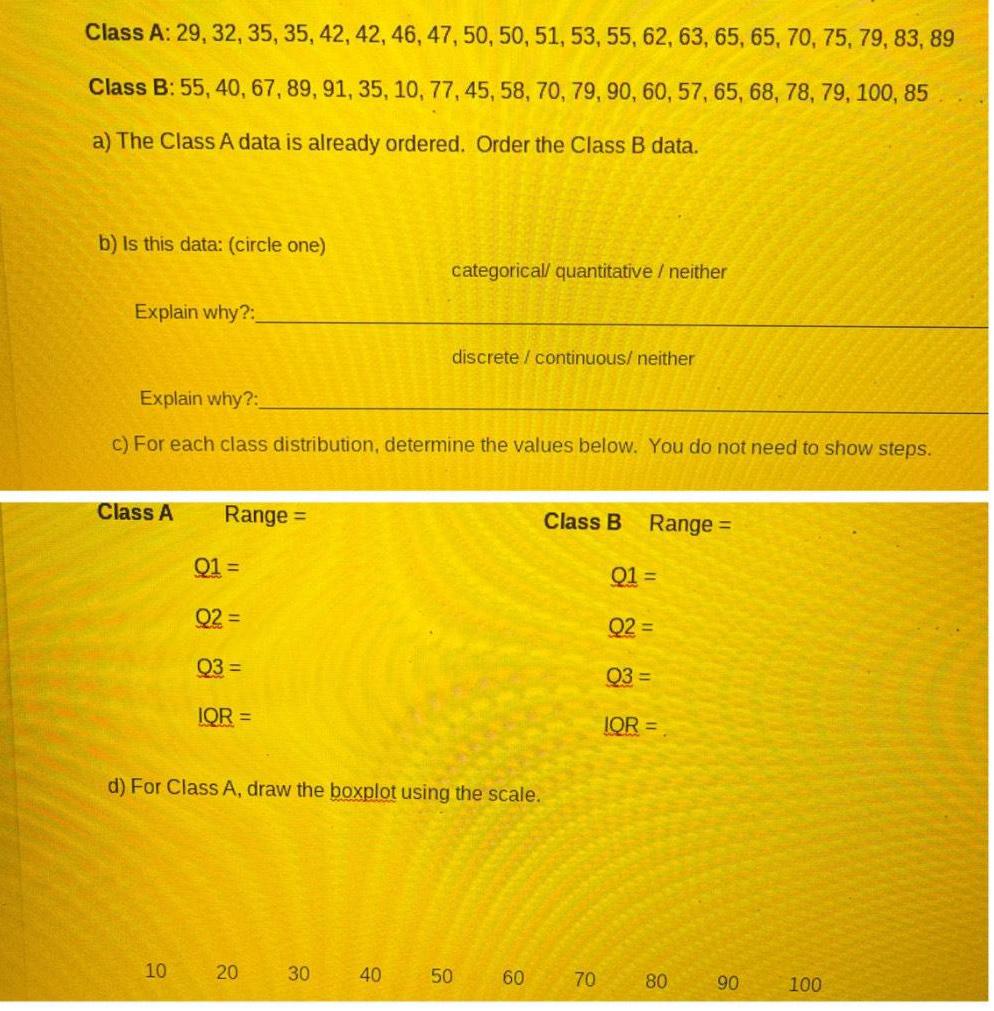
Class A 29 32 35 35 42 42 46 47 50 50 51 53 55 62 63 65 65 70 75 79 83 89 Class B 55 40 67 89 91 35 10 77 45 58 70 79 90 60 57 65 68 78 79 100 85 a The Class A data is already ordered Order the Class B data b Is this data circle one Explain why Class A Range Explain why c For each class distribution determine the values below You do not need to show steps Q1 10 Q2 Q3 IQR d For Class A draw the boxplot using the scale 20 categorical quantitative neither 30 discrete continuous neither 40 50 60 Class B Range 70 01 Q2 Q3 IQR 80 90 100
Other questions asked by students
Q
In this multi-part exercise, we'll prove another result alluded to in class, namely that if the...
Basic Math
General Management
Accounting
Finance