
Transcribed Image Text
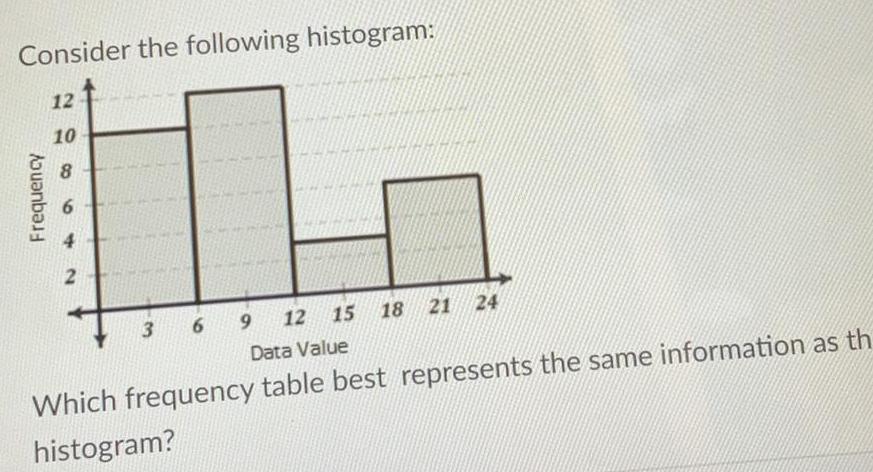
Consider the following histogram 12 10 8 Frequency 2 3 6 9 12 15 18 21 24 Data Value Which frequency table best represents the same information as th histogram
Other questions asked by students
Q
You are at a wetland site. You have been instructed to test for chromium contamination. Suppose...
Basic Math
Accounting
Accounting
Accounting