
Transcribed Image Text
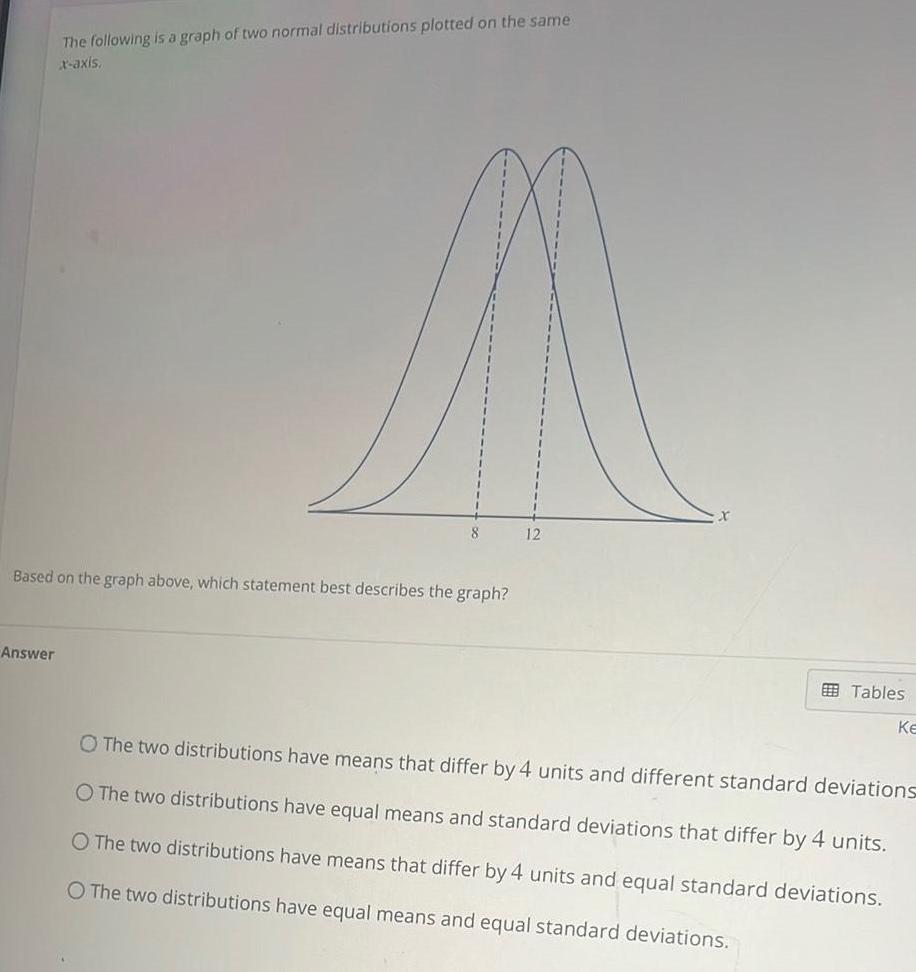
The following is a graph of two normal distributions plotted on the same x axis Answer 8 Based on the graph above which statement best describes the graph 12 Tables Ke O The two distributions have means that differ by 4 units and different standard deviations O The two distributions have equal means and standard deviations that differ by 4 units O The two distributions have means that differ by 4 units and equal standard deviations O The two distributions have equal means and equal standard deviations
Other questions asked by students
Q
Which of the following solutions would have the highest pOH? a. 0.2 M KOH b. 0.1 M NaOH c. 0.2 M...
Chemistry
Civil Engineering
Accounting
Accounting