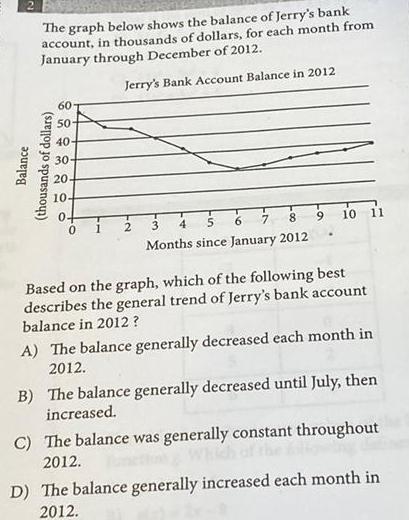
The graph below shows the balance of Jerry s bank account in thousands of dollars...
70.2K
Verified Solution
Link Copied!
Question
Geometry
The graph below shows the balance of Jerry s bank account in thousands of dollars for each month from January through December of 2012 Jerry s Bank Account Balance in 2012 Balance thousands of dollars 60 50 40 30 20 10 8 9 10 11 5 6 7 Months since January 2012 Based on the graph which of the following best describes the general trend of Jerry s bank account balance in 2012 A The balance generally decreased each month in 2012 B The balance generally decreased until July then increased C The balance was generally constant throughout which 2012 D The balance generally increased each month in 2012
Answer & Explanation
Solved by verified expert
Get Answers to Unlimited Questions
Join us to gain access to millions of questions and expert answers. Enjoy exclusive benefits tailored just for you!
Membership Benefits:
Unlimited Question Access with detailed Answers
Zin AI - 3 Million Words
10 Dall-E 3 Images
20 Plot Generations
Conversation with Dialogue Memory
No Ads, Ever!
Access to Our Best AI Platform: Zin AI - Your personal assistant for all your inquiries!